
Progress and challenges in the Americas: The evolving landscape of health and equity in the Region
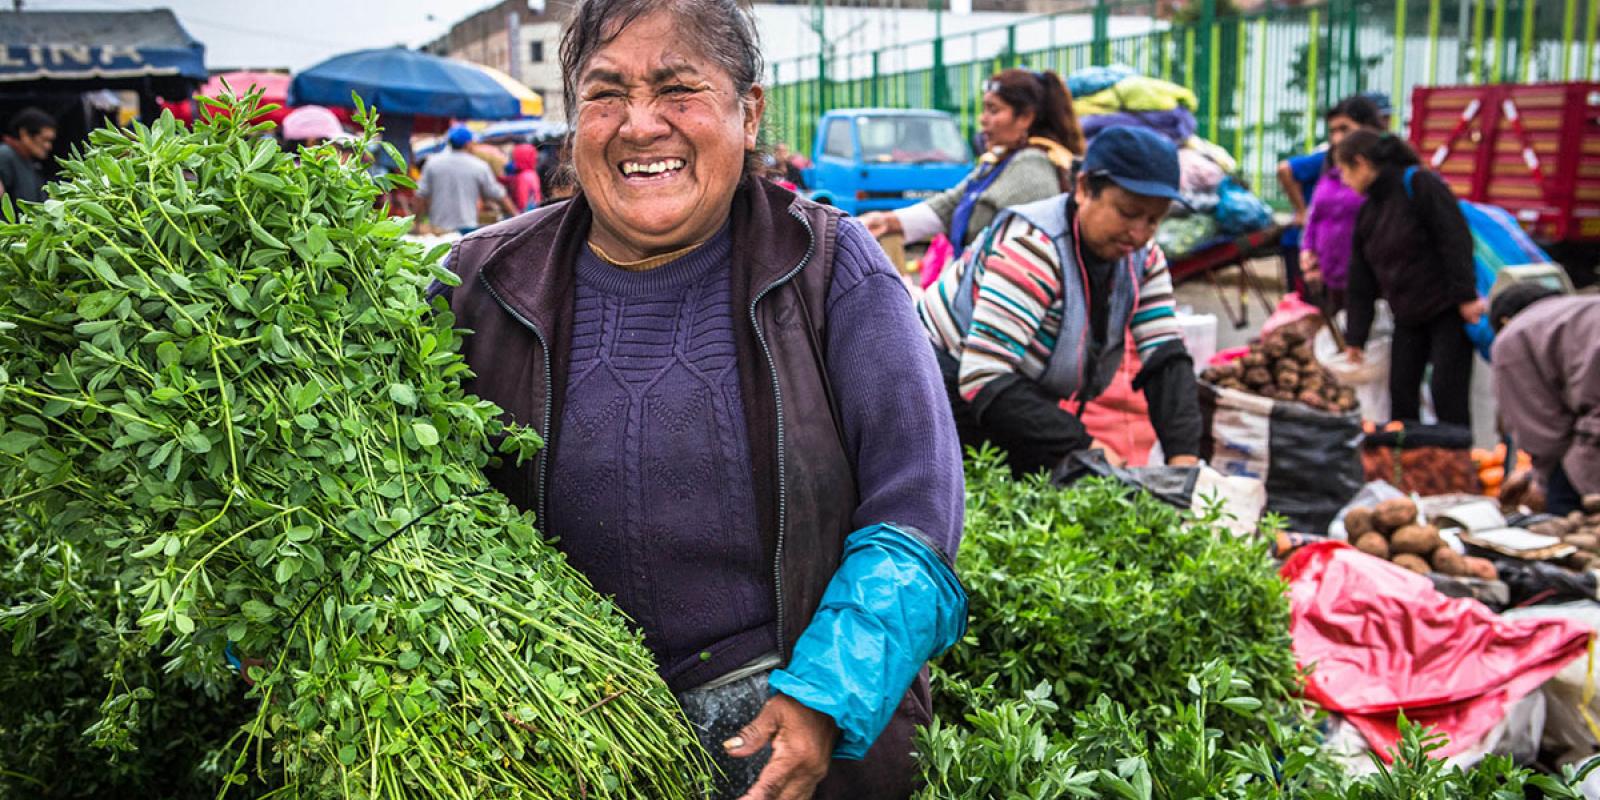
Photo: Courtesy of Juan Arredondo/Getty Images/Images of Empowerment. Some rights reserved.
Key messages
- The Region of the Americas has made major health gains. People are living longer: life expectancy in 2023 reached 77.1 years, surpassing the pre-pandemic level of 76.7 years in 2019. People are also living healthier lives, although improvements in health have been slower than gains in longevity.
- Progress has been uneven. Regional averages hide large gaps between and within countries. Income, where people live, education levels, and access to health services all play a major role in determining who benefits from health improvements and who gets left behind.
- Universal health coverage remains an unfinished agenda. More people can access essential health services than before, but out-of-pocket spending on health continues to push households into financial hardship.
- Populations are changing in ways that affect health needs. People are living longer, families are smaller, and migration is reshaping communities. At the same time, more people are living with chronic illnesses and disabilities. Together, these shifts are putting new pressures on health systems.
- Economic constraints are making it harder to increase investments in health. Slower economic growth, limited health budgets, and persistent inequality mean countries must make difficult choices about where to invest resources to achieve the greatest health impact.
- Regional frameworks provide a foundation for action. PAHO’s 2026–2031 Strategic Plan and other regional initiatives offer a path forward, but future progress will require fairer distribution of health benefits, more efficient use of resources, and sustainable financing.
The Region of the Americas has made substantial progress in health over recent decades. People are living longer, more people can access essential health services, and governments have invested in their health systems – from increasing funding and strengthening the capacity of the health workforce to developing national strategic plans and improving the quality of care (1). However, these gains are not shared equally across or within countries, nor are they guaranteed to last. Many households still struggle to afford health care, and the Region faces mounting pressures that threaten to slow or reverse progress. Populations are aging, families are getting smaller, and violence and road traffic accidents remain persistently high. Furthermore, the types of health problems people face are shifting, with more chronic diseases and disabilities alongside infectious diseases. These changes are creating new demands for health services. Meanwhile, slower economic growth and competing priorities limit the resources available to meet these demands. Underlying all these trends are persistent inequities tied to people’s income, where they live, and their social conditions. These factors determine who benefits from health investments and who gets left behind. This chapter examines these intersecting dynamics to provide the necessary context for the challenges and trade-offs explored in this edition of Health in the Americas.
Are people in the Americas living longer and healthier lives?
In 2023 life expectancy at birth in the Americas was 77.1 years, surpassing the pre-pandemic peak of 76.7 years in 2019 (Figure 1). At the start of the millennium, the Region had the highest life expectancy compared with other World Health Organization (WHO) regions, but it has experienced flatter progress than others, notably the European Region (78.5 years in 2023) and the Western Pacific Region (77.8 years). Projections estimate that this gap will persist through 2050 while the African Region and Southeast Asia Region will continue to catch up.
Life expectancy at birth by WHO region, 2000–2050 (projected after 2023)
Health-adjusted life expectancy (HALE) is the number of years an individual at a given age is expected to live in “good health” accounting for premature death and nonfatal health outcomes caused by disability. HALE has also increased in the Americas since 2000 but more slowly than overall life expectancy. Between 2000 and 2023, life expectancy in the Americas increased from 73.2 years to 77.1 years, at an overall pace of slightly more than two months per year. In contrast, HALE increased from 63.1 years to 64.5 years during that time period, or at an average pace of about three weeks per year (2).
This divergence in life expectancy and HALE rates highlights that gains in longevity have not been matched by equivalent improvements in healthy life years. In fact, the Region of the Americas exhibits the lowest proportion of healthy life to overall life expectancy when compared with other WHO regions – a trend that has accelerated in recent years (Figure 2). In other words, while the people of the Americas are living longer than ever, they are spending a smaller proportion of that time in full health.
This pattern, along with the slower pace of improvement in life expectancy for the Americas compared with other regions of the world, may reflect a disconnect between longevity gains and the underlying social conditions that shape them (3, 4). Health outcomes depend on more than just health care. They are also shaped by social determinants of health, which WHO defines as “the circumstances in which people are born, grow, live, work and age, and people’s access to power, money and resources” (5). These include factors such as social class, gender, race, ethnicity, income, working conditions, housing quality, and other impacts on day-to-day living. Individual behavioral choices and health system resources also matter, operating within these broader social and economic contexts.
Health-adjusted life expectancy (HALE) as a percentage of total life expectancya by WHO region, 2000–2023
Health inequities within the Region
These regional averages in life expectancy and HALE provide an important snapshot for global benchmarking and comparison, but they mask significant inequities within the Region. To examine equity patterns within the Region, this chapter groups countries using the Institute for Health Metrics and Evaluation’s Socio-Demographic Index (SDI) – a composite measure of development status that combines fertility rates for those under 25 years, average educational attainment for those 15 years and older, and lag distributed income per capita. The SDI ranges from 0 (lowest) to 1 (highest) and is strongly correlated with health outcomes.
Figure 3 shows the distribution of SDI scores by country in 2023, revealing striking variation. Haiti had the lowest SDI score of 0.464, while Canada had the highest at 0.887. Most countries in Central America cluster in the lower to middle range, while Northern American, Caribbean, and several South American countries, such as Argentina, Chile, and Uruguay, appear in the higher range. These gaps reflect profound differences in not only development status but also the nonmedical differences that determine health, such as income and education.
Using the Fisher-Jenks algorithm method, five groups of countries emerge (Groups A–E) for this chapter’s equity analysis. Countries in Group A have the lowest SDI scores and represent the lowest development status while countries in Group E have the highest scores and represent the highest development status.
Socio-Demographic Index by country,a Region of the Americas, 2023
The inequities shown in Figure 3 translate directly into differences in health outcomes. Analysis of HALE by SDI groups reveals that the HALE rate differs from one SDI group of countries to another (Figure 4). In 2023 Group A countries – the group with the lowest SDI scores – had an average HALE at birth of 60.1 years. In contrast, Group D countries – the countries with the second-highest SDI scores – had an average HALE of 67.1 years, the highest of all groups. Group E countries, which include Canada and the United States of America, slipped below Group D countries in average HALE for the first time in 2008, despite having a higher level of development. Group E’s HALE in 2023 was 64.9 years.
Differences in HALE also appear between women and men across the groups of countries (Figure 4). In 2023 women lived more years in good health than men across all country groups, ranging from 1.4 additional years in Group A countries to 3.7 additional years in Group B countries. This gender gap has been long-standing but has narrowed somewhat in recent years. The gap may be explained by the fact that men face higher mortality than women for some conditions, such as ischemic heart disease and respiratory tract cancers, as well as from violence, road and work-related injuries, suicide, and drug use disorders (6).
Health-adjusted life expectancy (HALE) by sex and SDI country group,a Region of the Americas, 2000–2023
Is health spending translating into longer life expectancy?
Countries have been spending more on health as aging populations need more care and disease patterns change. New and often expensive health technologies have also expanded what can be treated while investments in pandemic preparedness have grown.
A key question is whether increased health spending translates into improved outcomes. Figure 5 (a) shows the relationship between current health expenditure per capita and life expectancy from 2000 to 2023. Labeled countries in color represent those with the highest life expectancy for a given level of health expenditure. All other countries in the Region are shown in gray. Figure 5 (b) shows the same relationship for 2023, with countries color-coded by SDI country group. (See Appendix I for additional time-series figures by SDI group.)
Relationship between current health expenditure per capitaa and life expectancy at birth by country,b Region of the Americas, 2000–2023
Relationship between current health expenditure per capitaa and life expectancy at birth by country and SDI group,b Region of the Americas, 2023
The data emphasize two key messages. First, there is a clear upward pattern, suggesting a positive correlation between how much a country spends on health and how long people live. However, life expectancy is influenced by far more than health spending alone. As mentioned previously, social determinants of health, such as income, education, housing, and access to clean water, also play major roles in shaping how long people live, regardless of how much countries invest in their health systems.
The data emphasize two key messages. First, there is a clear upward pattern, suggesting a positive correlation between how much a country spends on health and how long people live. However, life expectancy is influenced by far more than health spending alone. As mentioned previously, social determinants of health, such as income, education, housing, and access to clean water, also play major roles in shaping how long people live, regardless of how much countries invest in their health systems.
The second key message is that there may be opportunities to improve efficiency in some countries’ health system investments. Countries in the top center portion of Figure 5 (a), including Peru, Costa Rica, and Chile, achieved long life expectancy with relatively modest levels of health expenditure. This suggests they may have efficient health systems (7). Countries in the top right portion of Figure 5 (a) may have potential to optimize their investments, as they spent relatively more on health while achieving life expectancy levels comparable to some lower-spending countries. In addition, the 2023 snapshot in Figure 5 (b) reveals that countries spending similar amounts on health achieve different life expectancy outcomes. This variation suggests that careful prioritization of health system investments along with strategic policies and governance decisions may increase the return on investment beyond simply spending more. One example of a strategic decision is the prioritization of cost-effective interventions, such as WHO’s list of “best buys”to prevent and control noncommunicable diseases (NCDs) (8).
Looking forward, countries can expect health expenditure to increase as the Region continues to experience economic growth and as their populations age, with per capita values projected to double in nearly all countries in the Region by as early as 2050 (9).
Are essential health services reaching everyone and can people afford them?
In addition to helping people live longer, healthier lives, the countries of the Americas strive to guarantee consistent and equitable access to quality health services and interventions. This effort is formalized within Sustainable Development Goal Target 3.8 to achieve universal health coverage (UHC), which includes strengthening financial risk protection, access to quality essential health services, and access to safe, effective, quality, and affordable essential medicines, vaccines, and other health products such as diagnostics and devices for all (10). WHO measures UHC achievement through two indicators: coverage of essential health services, and the proportion of the population facing financial hardship in health.
Coverage of essential health services
Essential health services are defined as availability of reproductive, maternal, newborn, and child health services, infectious disease care, and NCD care, as well as service capacity and access. The Region of the Americas has made notable progress on coverage of essential health services compared with other WHO regions (11).
Figure 6 (a) shows how government health spending relates to essential health service coverage from 2000 to 2023. Domestic government spending is examined here because publicly financed interventions more directly shape service coverage. Labeled countries in color represent those with the highest coverage of essential health services for a given level of government spending. All other countries in the Region are shown in gray. Figure 6 (b) shows the same relationship for 2023, with countries color-coded by SDI country group. (See Appendix I for additional time-series figures by SDI group.)
Relationship between domestic general government health expenditure per capitaa and coverage of essential health services by country,b Region of the Americas, 2000–2023
Relationship between domestic general government health expenditure per capitaa and coverage of essential health servicesb by country and SDI group,c Region of the Americas, 2023
Similar to the patterns observed with life expectancy in Figure 5, the data in Figure 6 show a positive pattern: generally, as government health expenditure increases, so does essential health service coverage. Countries in the top center portion of Figure 6 (a), such as El Salvador, Barbados, Brazil, and Costa Rica, achieved high service coverage with relatively modest levels of government health expenditure between 2000 and 2023, suggesting efficient health systems. Haiti has faced challenges with both low health expenditure and service coverage, while Canada and the United States have invested substantially more with high service coverage at the other end of the spectrum.
The 2023 snapshot in Figure 6 (b) reveals substantial variation in service coverage among countries with comparable government spending levels, mirroring the efficiency differences seen in Figure 5. These differences point to opportunities for improving health system performance through policy and governance choices, such as prioritizing appropriate interventions and strengthening service delivery platforms, to help countries achieve better coverage at their current spending levels. The relationship between service coverage and government spending is influenced by many factors, including health system costs, social determinants of health, and political and policy contexts. Policy choices also influence the reliable availability of essential inputs, such as workforce, diagnostics, medicines, vaccines, and equipment, which determine whether priority services can be continuously delivered (examined in more detail in Chapters 3 and 4).
Financial hardship in health
WHO’s second indicator of UHC achievement is financial hardship. While government investment in health and service coverage have expanded substantially over the past two decades, financial hardship for households persists (11, 12). All WHO regions, including the Americas, have struggled to reduce the number of people facing high healthcare expenses. Out-of-pocket (OOP) expenditure above 20% of total current health expenditures is typically considered problematic (1), and the Region’s OOP expenses still account for nearly one-third of the Region’s current health expenditures (13).
Households in less developed countries bear a disproportionate financial burden for health care compared with households in more developed countries. In more developed countries, pooled financing mechanisms have expanded considerably, offering financial protection for families. For example, in 2023 households in the least developed countries in the Region (SDI Group A) shouldered 53% of domestic health spending via OOP costs – more than four times greater than households in the most developed countries (SDI Group E) (11%). In Group E countries, robust government and compulsory schemes contributed most of the financing. Other factors such as age and living arrangements can also affect a household’s OOP costs. Rural or multigenerational households generally face higher rates of financial hardship due to OOP spending, especially those living with adults over the age of 60 years (11).
Composition of current domestic health expenditurea by SDI country group,b Region of the Americas, 2023
Financial hardship due to OOP health expenditures has two components: (1) large spending that exceeds 40% but remains below 100% of a household’s discretionary budget, and (2) impoverishing spending that exceeds 100% of a household’s discretionary budget – either among people already in poverty who have no discretionary budget or by those pushed into poverty by their OOP health expenses (14). As shown in Figure 8, financial hardship in the Region is driven primarily by impoverishing spending rather than large spending. The financial hardship is heavily concentrated among people already living in poverty (11).
In 2022 just over one-fifth of the global population experienced impoverishment from OOP health spending. The regional average was lower than the global average, although substantial variation exists across countries. Argentina, Nicaragua, Peru, and Haiti had higher percentages of impoverishing spending than the global average.
Percentage of the population experiencing financial hardship due to out-of-pocket (OOP) health spending, selected countries in the Americas vs. global and regional averages, latest available survey year,a 2013–2023
What other key factors beyond the health system shape health?
The health service coverage and financial protection challenges described above are shaped by deeper structural issues, including aging populations, migration, economic constraints, and social inequality. All these factors impact access to care, which can result in unmet healthcare need and health inequities between and within countries. Across 17 PAHO Member States, an average of 35% of the population reports unmet healthcare needs, ranging widely across countries, from 3% in Costa Rica to 73% in Peru (15). These gaps have remained relatively stable over time and have followed clear income-related patterns: unmet needs are twice as high in lower-middle-income countries (49%) than high-income countries (23%) and affect poorer people within countries.
The most frequently reported barriers to health care are organizational, including service availability, long wait times, and fragmented services. Financial barriers follow closely, although their relative importance varies by context (16). Other demand-side factors also matter, such as health literacy, cultural acceptability, language, trust in providers, and ability or desire to navigate health systems. Qualitative evidence reveals how perceived quality of care, discrimination, administrative hassles, and past experiences influence whether people seek care – things that quantitative surveys often miss.
These access barriers are themselves shaped by broader social, environmental, political, and economic factors, as mentioned above. Income inequality, racial and ethnic inequity, education gaps, housing issues, employment, and living conditions contribute to the trends examined throughout this chapter, including why life expectancy differs between and within countries, why health service coverage varies, why some households face higher financial hardship due to health than others, and why some populations are more vulnerable to demographic and economic pressures.
Income, in particular, profoundly impacts health outcomes and access to care. People in the poorest income quintile have much higher rates of maternal mortality (7 times), infant mortality (4.5 times), and mortality due to unsafe water, sanitation, and hygiene (WASH) access (6 times) compared with people in the richest income quintile (17). In 2022, 29% of the population in Latin America lived in poverty and 11% in extreme poverty.
Demographic pressures, migration flows, and broader economic constraints are also important social determinants of health that are interconnected and compound one another. Aging populations increase demand for health services as slower economic growth limits budgets. Migration reshapes both who needs care and who provides it. Underlying these dynamics, social inequities continue to determine who bears the greatest burden. Understanding these connections is essential for addressing the health system challenges discussed in Chapter 2.
Income and other social determinants of health can have a profound impact on health outcomes and access to care.
Demographic changes
Between 2000 and 2023, the Region’s population grew from more than 800 million to nearly 1.05 billion – an increase of about 30% (18). Despite this growth, families are becoming smaller. In 2023 the global fertility rate was hovering at 2.2 children per woman, just above the commonly accepted population replacement rate of 2.1 (the rate at which population size remains constant from one generation to the next). The Region had already crossed this threshold in 2012 (18), and by 2023 the regional rate had dropped to 1.7 children per woman.
Total fertility rate by country, a Region of the Americas, 2000–2050 (projected after 2023)
Fertility rates vary across the Region but are converging (Figure 9). In 2000 rates ranged from a high of 4.6 children per woman in Guatemala to a low of 1.5 in Canada. By 2023 Haiti had the highest rate at 2.7 and Chile the lowest at 1.2. Projections estimate that all countries will fall below the 2.1 replacement rate by 2050.
Combined with longer life-spans, declining fertility means the Region of the Americas is aging rapidly compared with other WHO regions (19). In 2000, 5–9 year-olds made up the largest portion of the population (9.8% of males and 9.2% of females), giving the Region’s population pyramid a distinctive triangular shape (Figure 10). By 2023 fewer babies were born each year, creating a “beehive”-shaped pyramid with more even distribution among the bottom half of age cohorts. The largest age groups shifted to 30–34 year-olds for females (7.4%) and 15–19 year-olds for males (7.6%).
Population distribution by age and sex, Region of the Americas, 2000 vs. 2023
An aging population poses two major challenges for health systems. First, systems must adapt to address changing disease patterns and conditions that are more common among older people – particularly NCDs, mental health conditions, and disabilities – requiring new service delivery models and research priorities. Second, inputs and resources may contract as tax revenues fall and fewer workers are available to staff the health workforce (20).
Migration
Migration impacts personal health in key ways, including the introduction of new mental health stressors and environmental health risks. Migrants are more likely to be employed in the informal sector without social protections; live in substandard housing; face social isolation, language barriers, and sometimes violence; and often lack documentation and legal recognition. They also frequently struggle to access affordable, essential, and continuous health care. For example, migrants in precarious employment are disproportionately represented in jobs with long working hours and poor working conditions. Estimates from WHO and the International Labour Organization link long working hours to approximately 745 000 deaths per year from stroke and ischemic heart disease alone, representing the largest single source of work-related mortality globally (21). Some migrants underuse preventive and primary health care (PHC), which, in concentrated diaspora communities, may shift the demand for health services downstream to acute or emergency care. Additionally, migration reshapes the health workforce itself: some countries benefit from an influx of health workers, whereas others may face workforce shortages as workers emigrate or leave temporarily.
In 2024 there were 14 million intraregional migrants in Latin America and the Caribbean and 27 million nationals of Latin American and Caribbean origin in Canada and the United States (22). Canada, the United States, Chile, and Colombia had the highest inflows of migrants per 1000 people in 2023 while Saint Vincent and the Grenadines, Guyana, the Bolivarian Republic of Venezuela, and El Salvador had the highest outflows (Figure 11).
Crude net annual migration per 1000 population by country, Region of the Americas, 2023
Internal displacement has similar impacts on health as international migration. In 2023 internal displacement in the Americas accounted for nearly 6% of all internal displacements globally. Of those internally displaced, about one-quarter were due to conflict and violence and three-quarters to disasters, including hurricanes and other natural disasters (22).
Economic growth and health spending
Strong economic growth enables larger health system investments, which, in turn, can expand health services coverage, strengthen the health workforce, and improve service quality. Figure 12 tracks economic growth over time, starting in 2000 and projected to 2030. Since 2000, economic growth in the Region of the Americas has been below the global average, and the trend is projected to continue into 2030. The Region’s annual per capita gross domestic product growth averaged 3.8% compared with the global average of 4.7%. The exception was in 2021 during the COVID-19 pandemic recovery, when regional growth was 11.3% versus 11.1% globally. Projections estimate reasonable growth through 2030 for the Region, at 3.5–5.9% annually. If sustained, this trajectory could support gradual increases in government health expenditure, provided that health is prioritized in national budgetary decisions. Countries with slower or more volatile growth may face constrained budgets, potentially limiting the extent to which regional gains in coverage and health outcomes are shared broadly or sustained over time.
Annual percentage change in gross domestic product (GDP) per capita,a Region of the Americasb vs. global average, 2000–2030 (projected after 2024 or 2025c)
Beyond economic growth, other factors affect the fiscal space for health system investment including tax policy, spending efficiency, political interest, and prioritization among pressing or competing needs, such as pensions, education, and other public services.
Together, the trends outlined in this chapter paint a clear picture: the Region of the Americas has made real progress on health, but that progress is unevenly distributed, financially fragile for many households and some countries, and under pressure from demographic and economic forces that will intensify over the coming decades. Addressing these challenges requires health systems that are not only better resourced but also more equitable, efficient, and responsive to the health needs and social conditions that shape health from the ground up.
Responding to the challenge: PAHO’s strategic framework for regional health action
These challenges have been important motivators for PAHO’s and Member States’ regional agenda and are reflected in the new 2026–2031 Strategic Plan. For example, PAHO’s Better Care for NCDs Initiative and the Alliance for Primary Health Care in the Americas respond to the growing NCD burden (see Chapter 2) and the call to strengthen PHC investment, innovation, and implementation (see Chapter 3). The PAHO Disease Elimination Initiative addresses the infectious disease burden, which remains disproportionately concentrated in lower-development settings.
The PAHO Regional Revolving Funds operationalize equitable access to essential medicines and diagnostics, quality vaccines, and public health supplies through strategic purchasing and pooled procurement, reducing costs, improving the predictability of prices and delivery terms, and strengthening supply continuity. The Pan-American Highway for Digital Health, in partnership with the Inter-American Development Bank (IDB) and participating countries, promotes the interoperability of health information systems and the exchange of health information within and among countries. Stronger data infrastructure is essential for monitoring performance, setting priorities, and allocating resources – all of which are critical to meeting the challenges ahead. PAHO’s Innovation and Regional Production Platform promotes strategic partnerships, fosters research, and supports the development and production of health technologies in the Americas while providing technical cooperation to Member States and facilitating regional dialogue.
PAHO’s new Strategic Plan – approved in 2026 – provides a unifying vision for how it will contribute to improving health and well-being throughout the Region. Several commitments in the Plan directly respond to the trends noted in this chapter, including shaping research and knowledge dissemination agendas to better identify key priorities and inform courses of action for the Region and progressively eliminating OOP payments to improve access to quality, affordable, and effective health care. Additionally, the Plan commits to providing leadership and fostering partnerships where coordinated efforts are needed – particularly for addressing the complex and interrelated impacts of the social determinants of health (see Chapter 4).
...
Building on the broad context summarized in this chapter, Chapter 2 examines health loss patterns, including changes across the Region related to disability-adjusted life years (DALYs), premature death, disability, leading causes of illness and death, modifiable health risks, and potentially avertable disease burden. This analysis provides the empirical basis for the priority-setting and health system response agenda in subsequent chapters.