Health in the Americas 2022

Health in the Americas 2021: Potentially avoidable premature mortality (PAPM)


Although death is not avoidable, with advances in technology and health sciences it is possible to avoid a significant proportion of early (premature) deaths through preventive actions and timely medical care. This type of mortality is known as potentially avoidable premature mortality, and is commonly referred to as avoidable mortality.

An important goal of a State is to enable its inhabitants to have the longest, healthiest life possible. In a country with a well-functioning health system, premature deaths (under the age of 75 years) can often be avoided either through early public health interventions or through quality care if the diseases or other conditions have already developed. Although advances in public health have helped to extend life in many parts of the Region of the Americas, more than 2.5 million people in the Region still died due to potentially avoidable premature causes in 2019, the latest available data.

Trends in age-adjusted potentially avoidable premature mortality rates by sex for the region, subregions, and countries, Region of the Americas, 2000–2019

This figure shows the potentially avoidable premature death rates per 100,000 people in the population from 2000 to 2019. To help illustrate the trends, the findings are presented by sex, and can be broken down by the region, subregion, and country; and by whether the causes of death were preventable or treatable.

The mortality profile in the Americas has changed markedly in recent decades. In most countries, noncommunicable diseases and external causes have replaced communicable (infectious) diseases as the main causes of death. Despite improvements in avoidable mortality in the Region in the past two decades, avoidable causes of death have still been prevalent. In 2019, more than 2.5 million potentially avoidable premature deaths occurred in the 33 countries in the Region with data on the topic, accounting for about one out of every three deaths.


Total number of deaths by three Global Burden of Disease groups, according to year, sex, and subregion, Region of the Americas, 2000–2019

This figure shows the total number of death rates (millions) in the Region per 100,000 population from 2000 to 2019, grouped by three Global Burden of Disease categories: (1) communicable, maternal, perinatal, and nutritional conditions; (2) noncommunicable diseases; and (3) injuries. To help illustrate the trends, the findings can be broken down by region, subregion, and country; and by sex.


In recent years, countries in the Region of the Americas have experienced significant improvements in health outcomes, including decreases in potentially avoidable premature deaths. While there has been a decrease in inequality regarding the distribution of avoidable mortality in the Region, profound social inequalities in health persist with regard to reducing avoidable premature deaths. Between 2000 and 2019, the cross-country distribution of potentially avoidable premature deaths revealed unfair, unnecessary, and avoidable inequalities, disproportionately concentrated in the most disadvantaged countries. Countries with the least sustainable development (i.e., the most socially disadvantaged) have potentially avoidable premature mortality rates that are twice as high as those of the most developed countries. This inequality amounts to an excess of about 189 avoidable deaths per 100,000 population in the most socially disadvantaged countries. This means that investing more in the sustainable development of these countries can further reduce avoidable deaths.

Sustainable Development Index (SDIx) Methodology

The Sustainable Development Index (SDIx) is a summary measure of sustainable development that captures its three defined dimensions through three well-known and robust proxy indicators: gross domestic product per capita in deflated and purchasing power-adjusted international dollars (economic dimension, related to SDG target 10.1), mean years of schooling attained by those aged 25 to 29 years (social dimension, related to SDG target 4.2), and access coverage, at least basic, to sanitation services (environmental dimension, related to SDG target 6.2). The SDIx is a composite metric computed as the equally-weighted geometric mean of the three proxy indicators’ normalized indexes. The SDIx has been established by PAHO to be used as a standard equity stratifier for the analytical exploration of SDG 3-related health inequalities, as well as to create accountability on the promise to leaving no one behind in the 2030 Agenda for Sustainable Development.


Change in country, age-adjusted mortality rates for avoidable, preventable, and treatable mortality grouped by quintiles according to the Sustainable Development Index (SDI) value for each country in the Region of the Americas, 2000, 2009, and 2019

This visualization creates the opportunity to compare age-adjusted mortality rates in countries in the Region of the Americas in 2019 by quintile according to the Sustainable Development Index. Measures can be explored by avoidable premature deaths as a whole or broken down into preventable or treatable. The visualization shows the change in those measures in these countries across two decades using data from the years 2000, 2009, and 2019.


Sustainable Development Goal 3 (SDG3) is dedicated to ensuring healthy lives and promoting well-being for all. How well is the Region of the Americas moving towards this goal in terms of avoidable mortality? Health in the Americas looks at this progress through three lenses of how well countries are reducing preventable deaths: (i) mothers during childbirth; (ii) newborns in the first month of life; and (iii) adults from preventable chronic, noncommunicable diseases.

Sustainable Development Index (SDIx) Methodology

The Sustainable Development Index (SDIx) is a summary measure of sustainable development that captures its three defined dimensions through three well-known and robust proxy indicators: gross domestic product per capita in deflated and purchasing power-adjusted international dollars (economic dimension, related to SDG target 10.1), mean years of schooling attained by those aged 25 to 29 years (social dimension, related to SDG target 4.2), and access coverage, at least basic, to sanitation services (environmental dimension, related to SDG target 6.2). The SDIx is a composite metric computed as the equally-weighted geometric mean of the three proxy indicators’ normalized indexes. The SDIx has been established by PAHO to be used as a standard equity stratifier for the analytical exploration of SDG 3-related health inequalities, as well as to create accountability on the promise to leaving no one behind in the 2030 Agenda for Sustainable Development.


Sustainable Development Index (SDI) by country and year for the Region of the Americas, 2000–2019

Applying the SDI considers that only focusing on elements of human development could lead to extensive damage with climate change and ecological devastation, which would have a negative impact on progress in human development. In this visualization, countries with the highest ratings are making progress in both human development and ecological efficiencies in delivering human development. Each of the countries can be explored by year to see the change over time.

In recent years, countries in the Region of the Americas have experienced significant improvements in health outcomes, with decreases in potentially avoidable premature deaths. Although health system performance is not solely responsible for potentially avoidable premature mortality, guaranteed access to health services and universal health coverage play a fundamental role.


Age-adjusted mortality rates for avoidable, preventable, and treatable mortality by country, Region of the Americas, 2000–2019

This visualization allows the opportunity to examine age-adjusted mortality rates from avoidable causes in countries in the Region of the Americas from 2000 to 2019 in comparison to the Region as a whole. In the chart on the right, values are shaded red when the country death rates are higher than those of the Region, yellow when there are no statistically significant differences, and green when the avoidable death rates in the country are lower than those of the Region as a whole. The avoidable causes of death can also be broken down into preventable or treatable. Avoidable premature deaths are deaths that occur before the age of 75 that should not occur. Avoidable premature deaths can be preventable (if they could have been prevented through primary prevention efforts) or treatable (if they could have been avoided through timely and good-quality medical care).

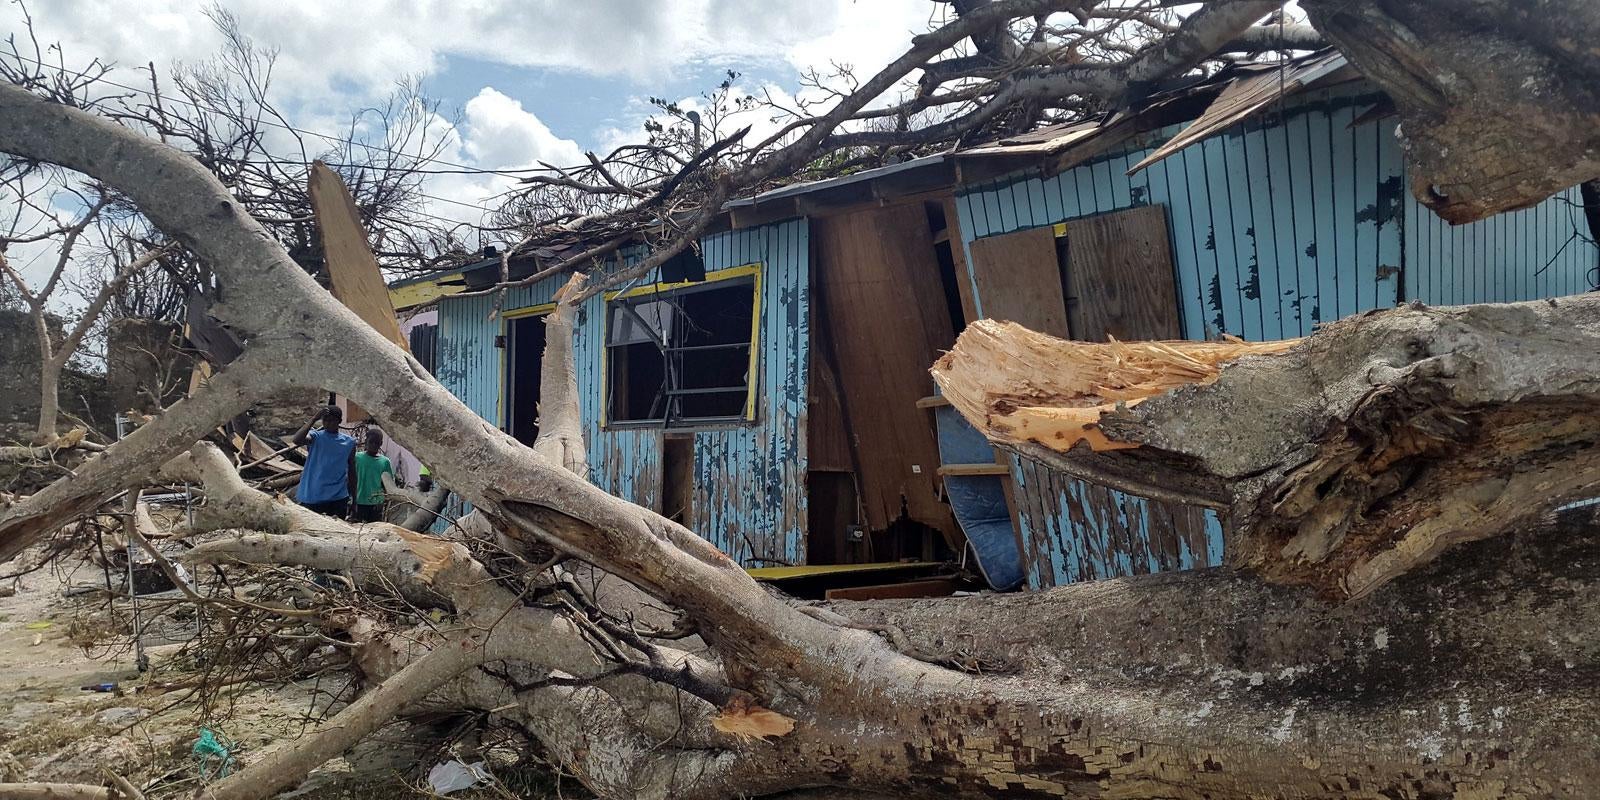
Disasters and emergencies (natural and otherwise) are on the rise globally and occur regularly in some countries in the Americas, especially those caused by hurricanes, flooding, and earthquakes. Disasters and emergencies have the catastrophic potential to suddenly increase premature mortality, most of which could be potentially avoidable with appropriate preparedness plans in place. To save lives, countries require strong, well-trained, multidisciplinary, emergency response systems, as outlined in the Health Sector Multi-Hazard Response Framework of the Pan American Health Organization. From this perspective, most deaths from disasters and emergencies are avoidable, but the health emergency caused by the COVID-19 pandemic has tested the effective response capacity of countries in the Region of the Americas. The virus has become a leading cause of death in the Region and has triggered significant regression in decades of progress in reducing premature deaths – both preventable deaths and causes of death that are treatable.


Map of age-adjusted mortality rates and trends for potentially avoidable premature mortality in the Region of the Americas, 2000–2019

This chart and map create the opportunity to explore avoidable premature death trends across multiple countries by year, sex, and the subsets of whether the deaths were preventable or treatable. To select multiple countries to compare, hold down "CONTROL" and click on the countries of interest. They will be filtered on the map and in the trend graph.

To reduce potentially avoidable premature deaths, global and regional commitments have been made over the past 20 years to improve the profile of noncommunicable diseases and their risk factors on health, social protection, and economic development agendas.


Dynamic age-adjusted, avoidable, preventable, and treatable premature mortality rates from 2000 to 2019 by sex, region, subregion, and country, according to the Sustainable Development Index (SDI), for the Region of the Americas, 2000–2019

The animated graphic illustrates the changes in aged-adjusted mortality rates due to potentially avoidable premature deaths in the region, subregion, or country by sex from 2000 to 2019. Click on the “play” button at the left of the vertical (y) axis to see the change by type of deaths (avoidable, preventable, or treatable) from 2000 to 2019. Note that you can individually select a country to illustrate the change over the period.