Accelerating Disease Elimination
Chapter 3: Perspectives on Disease-specific Interventions

 Summary
The Elimination Initiative in the Americas faces complex challenges, including healthcare disparities, political and economic barriers, and inadequate surveillance. Progress toward disease elimination targets can be measured by looking at incidence and prevalence, as well as examining the impact of disease control efforts and making projections about future disease progression. These analyses will help Member States adjust programs based on existing data. While the Region is seeing varying success tackling diseases in the Elimination Initiative, great disparities exist both among and within countries, driven by underlying health inequities and social determinants. Addressing access barriers and ensuring the success of the Elimination Initiative urgently requires developing a better understanding of the mechanisms behind inequity.
Challenges achieving elimination
The Elimination Initiative faces complex challenges in reaching its disease-specific targets, including healthcare disparities, political and economic barriers, inadequate surveillance, and cultural and linguistic diversity. While the previous chapter examined progress on elimination targets, this chapter digs deeper into some of the diseases that have not yet achieved their targets, to see what strategies have worked, what challenges exist, and what remains to be done. This chapter also explores equity indicators that can help PAHO and Member States ensure disease elimination efforts reach the most under-served and marginalized communities. Due to limited data availability and the need for sufficient data points to ensure accurate forecasting, only a limited number of diseases are included in this chapter's analysis.
Cervical cancer
In 2022, the age-standardized incidence and mortality rates for cervical cancer were 11.5 and 5.85 per 100,000 women, respectively, which represents 78 706 new cervical cancer cases and nearly 40 000 estimated deaths (1). The burden of cervical cancer in the Americas was significant, with mortality rates three times higher in Latin America and the Caribbean compared to North America, highlighting substantial disparities in wealth and access to healthcare services. If current trends persist, cervical cancer deaths in the Americas are projected to be as high as 5.37 per 100 000 women by the end of the initiative in 2030 (see Figure 5). Ensuring healthcare access and quality at the first level of care can improve pre-cancer screening, and treatment of precancerous lesions can prevent progression of the disease. Additionally, providing universal access to the human papillomavirus (HPV) vaccine could significantly reduce the risk of cervical cancer on a population level (2). Eliminating cervical cancer also requires prompt screening and treatment as well as palliative care.
Figure 5. Age-adjusted cervical cancer mortality rate projections in the Region of the Americas
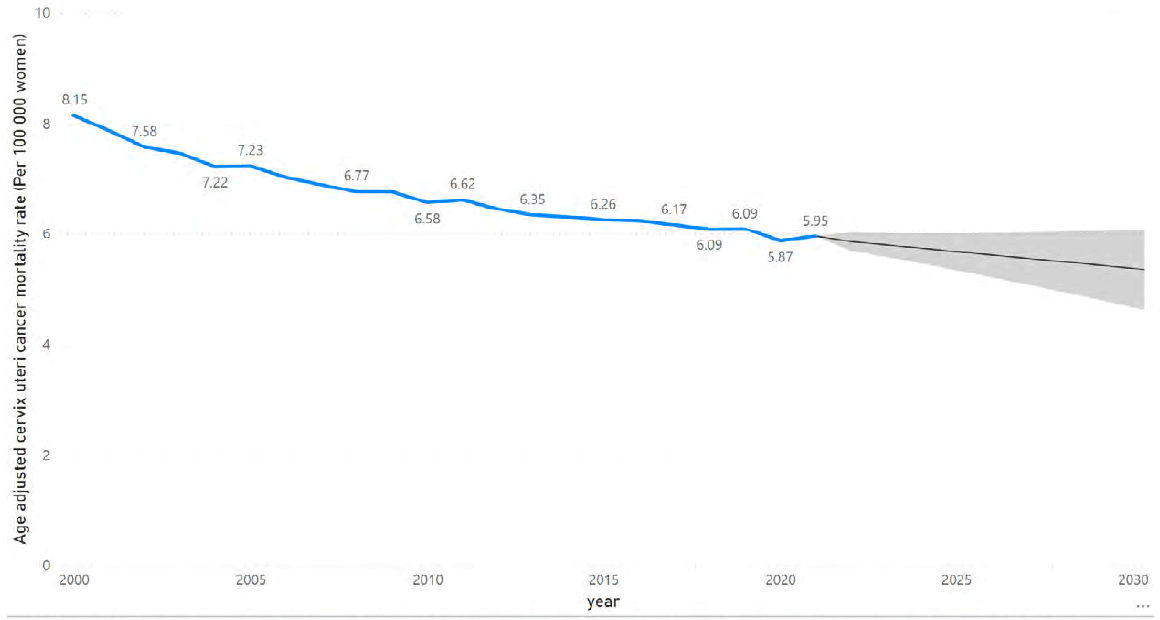
Source: World Health Organization. Global health estimates 2021: deaths by cause, age, sex, by country and by region, 2000–2021. Geneva: WHO; 2021 [cited 16 September 2024]. Available from: https://www.who.int/data/gho/data/themes/mortality-and-global-health-estimates/gheleading- causes-of-death.
PAHO collaborates with countries to implement the Regional Strategy and Plan of Action for Cervical Cancer Prevention and Control (2). This involves providing technical assistance and strengthening cervical cancer programs, using existing PAHO/WHO tools and resources. Additionally, PAHO's Regional Revolving Fund (RRF) can provide access to bulk purchasing of HPV vaccines at a standardized price across the Region. PAHO's ProVac Initiative has also developed a cost-effectiveness model to aid decision-making regarding the introduction of HPV vaccines and the enhancement of cervical cancer screening strategies. Ensuring that these actions are scaled up throughout the Region – particularly in areas with high prevalence of cervical cancer and low rates of vaccination – can improve progress toward the elimination target.
Cholera
The regional elimination target for cholera is the absence of community transmission for at least three consecutive years. Although the Region registered no cases in 2020 and 2021, a resurgence began in 2022. A total of 56 355 and 149 cases were reported by Haiti and the Dominican Republic, respectively, in 2023 (3).
Since predicting future cases is difficult, cholera elimination efforts must focus on prevention, preparedness, and response alongside a strong surveillance system for early case detection. For prevention, improving water supply and sanitation services is the most sustainable way to protect against cholera and other waterborne diarrheal diseases, although this may be unrealistic for populations living in extreme poverty in the Region (3). In this context, controlling mortality by cholera should be at the center of health services interventions. Use of available treatment is highly effective for those who become infected: up to 80% of cases can be treated through early administration of oral rehydration salts (4). Cholera surveillance should be part of an integrated national system with timely feedback at local, regional, and global levels, using the WHO standardized case definition to accurately estimate the global cholera burden and develop sustainable support strategies. In countries without reported cholera cases, health officials recommend monitoring acute diarrhea trends in adults, immediately reporting suspected cases, investigating all suspected clusters and confirming cases through laboratory testing. The deployment of cholera vaccine is an efficient tool for managing cholera outbreaks during complex emergencies, including humanitarian crises.
Environmental risk factors
Environmental risk factors in the Americas can lead to increased rates of respiratory illnesses, vector-borne and tropical diseases, cardiovascular diseases, and other chronic conditions. The Region struggles to mitigate the impact of these hazards, as inadequate waste management, deforestation, and exposure to toxic substances continue to compromise public health and well-being. Open defecation contributes to the spread of infectious diseases, contaminates water sources, and undermines sanitation efforts in many impoverished communities. In 2000, 52.3 million people practiced open defecation, and by 2020 this had decreased to 11.1 million. The Elimination Initiative is aiming for a 95% reduction in this behavior between 2020 and 2030. By 2021, this number decreased further to 9.1 million people. Continued reduction in this practice is likely; by 2026, the initiative forecasts that 0.01% of the Region's population will still be engaging in this practice, and in subsequent years, this value will reach close to 0.
Figure 6. Percentage of population practicing open defection in the Region of the Americas
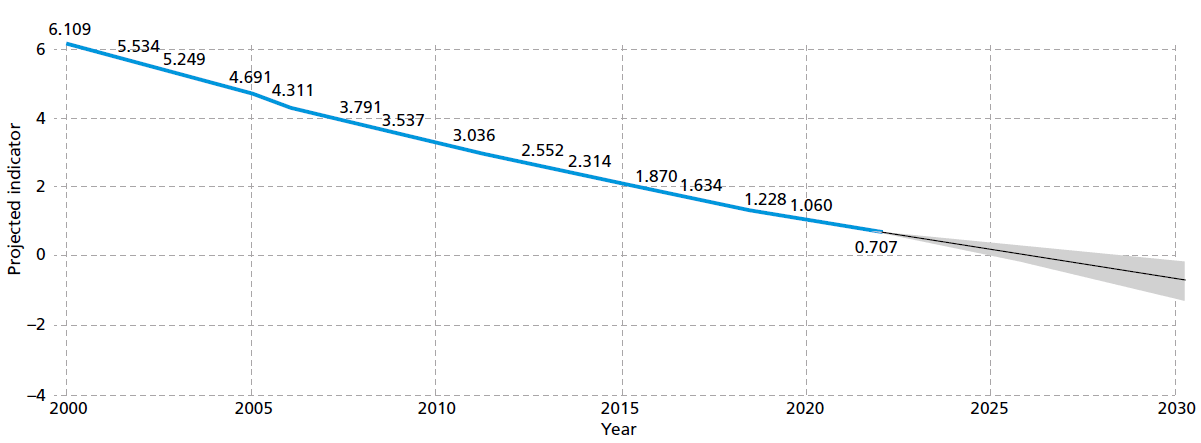
Source: World Health Organization. The global health observatory. Geneva: WHO; [date unkown] [cited 16 September 2024].https://www.who.int/data/gho.
Reducing the number of people in the Region dependent on household polluting fuels will improve health outcomes and protect the environment. Assessing how many people primarily rely on polluting fuels for cooking can serve as a proxy for estimating the progress associated with polluting fuel use across the Region. The forecasting analysis indicates that by 2030, the estimated proportion of people relying on polluting fuels will be 5.96%, close to the Elimination Initiative target of 5%. PAHO provides technical support to Member States to generate evidence for better management of water and sanitation services and review the financial accounts of the sector, using tools such as Global Analysis and Assessment of Sanitation and Drinking-Water (GLAAS) and Tracking Financing to WASH (TrackFin) (5). Additionally, efforts are underway to disseminate technical guidelines and strengthen surveillance systems (5). PAHO also supports performance improvement of environmental health programs, combined with actions to build an environmentally sustainable and resilient health sector by estimating the sector's air pollution footprint and promoting use of clean energy (6).
Figure 7. Percentage of population with primary reliance on polluting fuels and technologies for cooking in the Region of the Americas
Source: World Health Organization. The global health observatory. Geneva: WHO; [date unkown] [cited 16 September 2024].https://www.who.int/data/gho.
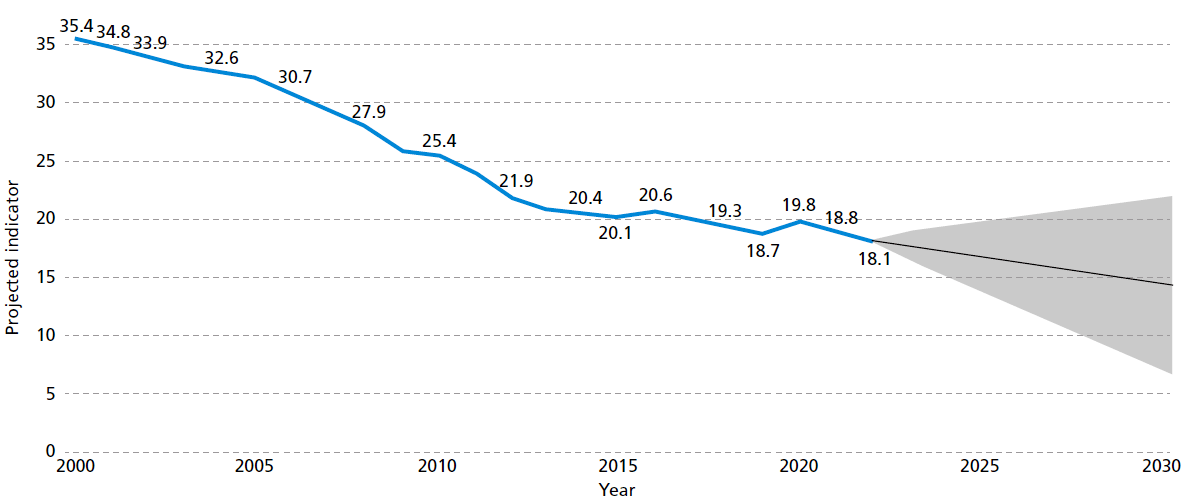
Mother-to-child-transmission
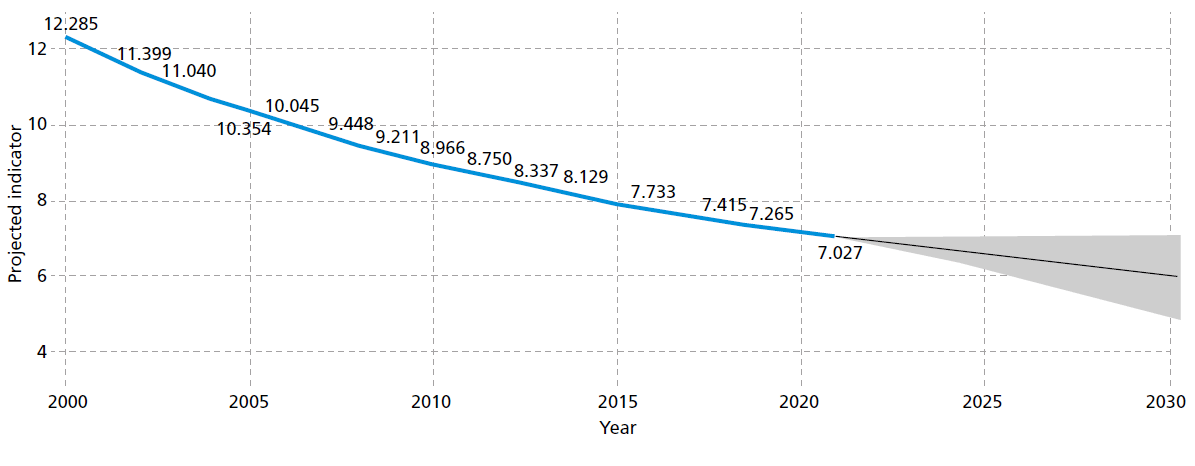
The mother-to-child transmission (MTCT) rate of HIV in the Region has been consistently decreasing, and, in 2022, 4900 new infections among children were avoided thanks to the MTCT strategy. However, reaching the 2030 target (MTCT of HIV of 2% or less) requires implementing efforts like increasing access to HIV testing and treatment among pregnant women.
Figure 8. HIV mother-to-child transmission rate in the Region of the Americas
Source: The Joint United Nations Programme on HIV/AIDS. AIDSinfo. Geneva: UNAIDS; [date unkown] [cited 16 September 2024]. https://aidsinfo.unaids.org.
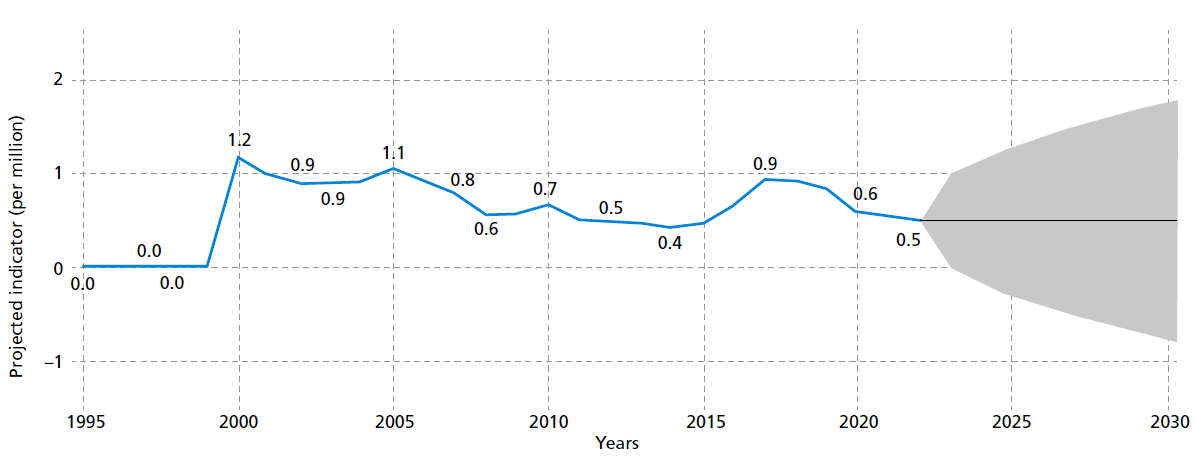
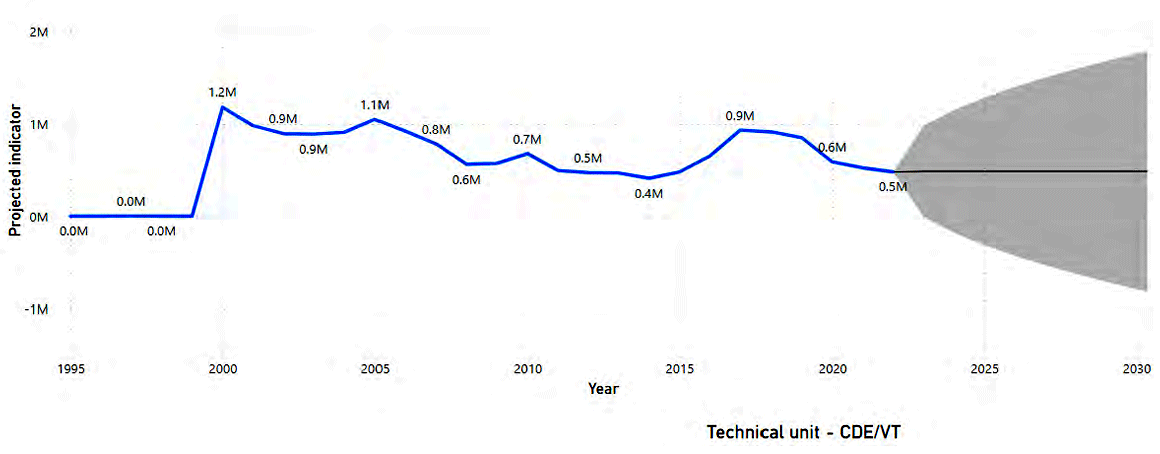
Figure 9. Congenital syphilis incidence rate in the Region of the Americas
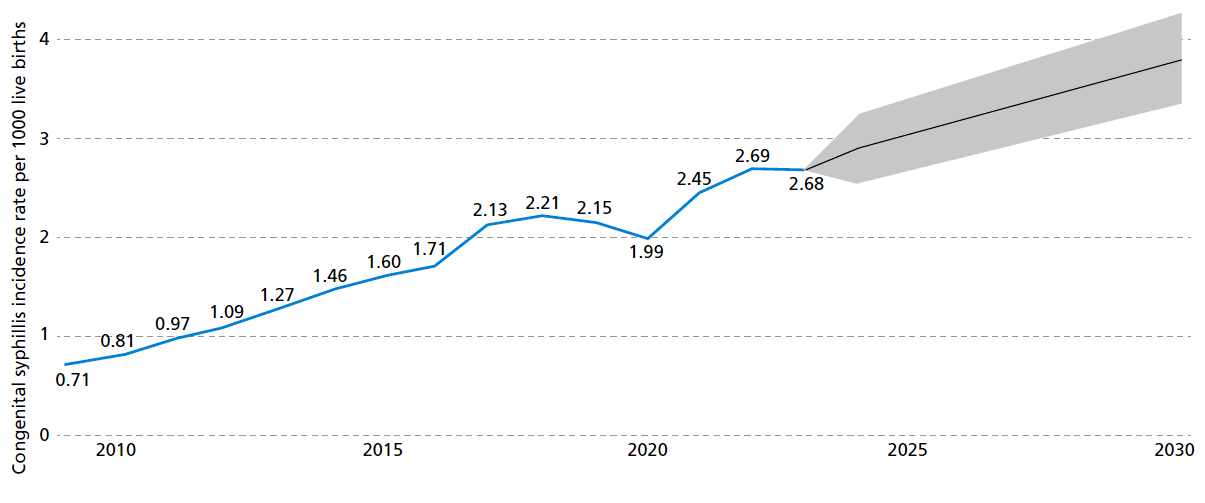
Source: Pan American Health Organization. Communicable disease prevention, control, and elimination. Washington, D.C.: PAHO; [date unkown] [cited 16 September 2024]. https://www.paho.org/en/communicable-disease-prevention-control-and-elimination. Countries excluded from the analysis: Barbados, Bonaire, Curacao, Dominican Republic, French Guiana, Grenada, Guadeloupe, Haiti, Martinique, Saba, Sint Eustatius, Sint Maarten, Suriname.
Syphilis is on the rise in the Americas, and this translates to higher prevalence among pregnant women and higher congenital syphilis rates. Managing MTCT of syphilis presents significant challenges, including limited access to comprehensive prenatal care, diagnostic, and treatment services, particularly in underserved and rural areas. Low awareness about syphilis further complicates prevention efforts. Barriers to timely and effective treatment include penicillin shortages, restrictions on who can prescribe the medication, and lack of follow-up after treatment. The forecasting analysis suggests that by 2030, the rate of congenital syphilis will increase to close to 3.7 per 1000 live births – therefore trending in the opposite direction of the desired elimination target of 0.5 per 1000 live births.
HIV
If current trends persist, the estimated number of HIV-related deaths by 2030 will be well above the established target of 65% reduction in comparison with the values presented in 2010.
Figure 10. Number of people dying from HIV-related causes in the Region of the Americas
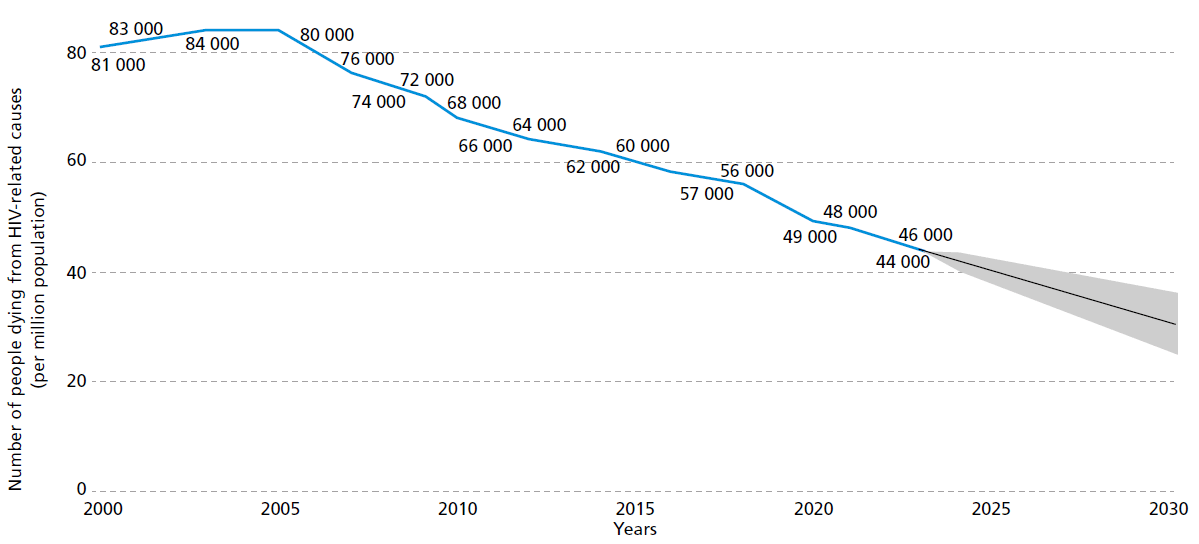
Source: The Joint United Nations Programme on HIV/AIDS. AIDSinfo. Geneva: UNAIDS; [date unknown] [cited 16 September 2024]. Available from: https://aidsinfo.unaids.org.
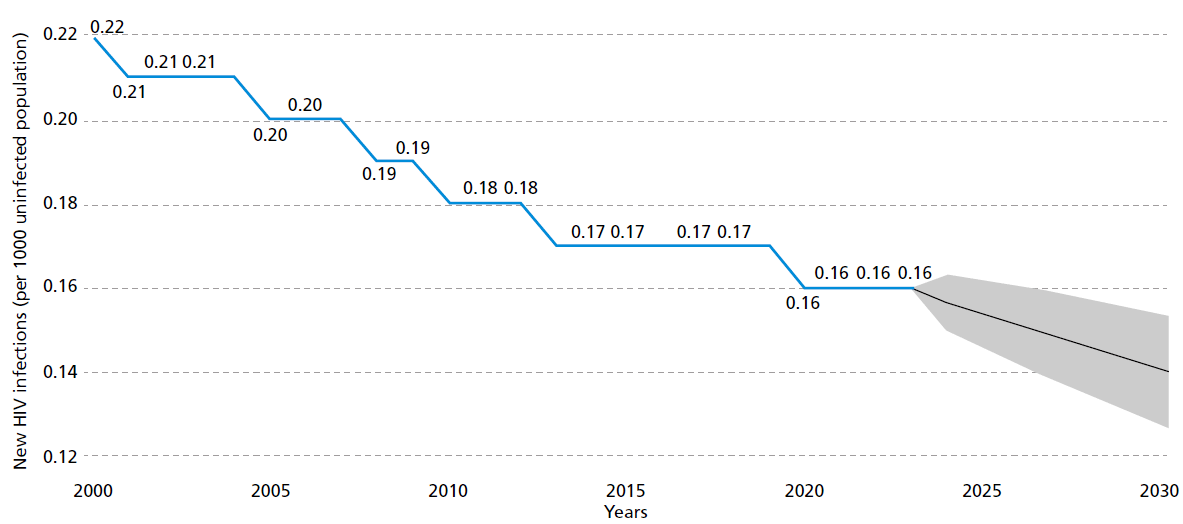
New HIV infections have decreased in the Region, and the trend projects an expected rate of 0.14 cases per 1000 non-infected population by 2030. To accelerate progress and reach the 2030 target (0.02 new cases per 1000 population), it is essential to expand access to combination prevention with a focus on key populations (7). The 75th World Health Assembly endorsed the Global Health Sector Strategies (GHSS) on HIV, viral hepatitis, and sexually transmitted infections (STIs) for the period of 2022–2030. The GHSS aim to guide countries in implementing effective prevention and treatment programs, with the goal of ending the epidemics of HIV, STIs, and viral hepatitis as public health problems by 2030 (8).
Figure 11: New HIV infections in the Region of the Americas
Source: The Joint United Nations Programme on HIV/AIDS. AIDSinfo. Geneva: UNAIDS; [date unknown] [cited 16 September 2024]. Available from: https://aidsinfo.unaids.org.
Tuberculosis
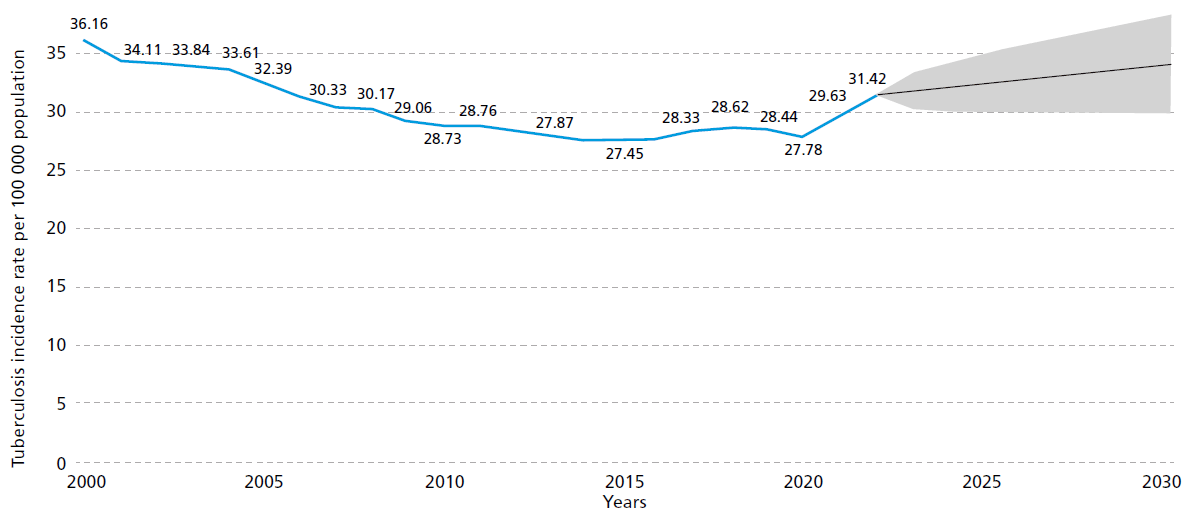
In 2022, tuberculosis remained one of the leading infectious disease killers globally, and was the leading cause of death among people living with HIV. Figure 13 illustrates that the incidence rate has varied, with a marked decline observed during the years 2019 and 2020, likely due to disruptions in the notification process caused by the COVID-19 pandemic. Projections indicate a possible increase of the incidence rate by 2030, underscoring the continued need for sustained efforts to combat tuberculosis in the Region.
Figure 12. Tuberculosis incidence rate in the Region of the Americas
Source: World Health Organization Global Tuberculosis Programme. Global tuberculosis report 2021. Geneva: WHO; 2021. https://iris.who.int/bitstream/handle/10665/346387/9789240037021-eng.pdf.
PAHO and WHO are actively supporting countries in the Americas through various initiatives to reduce tuberculosis incidence and mortality. The End TB Strategy aims to end the global tuberculosis epidemic. The strategy focuses on reducing tuberculosis deaths by 95% compared to 2015, reducing new cases by 90% between 2015 and 2035, and ensuring that no family faces catastrophic costs due to tuberculosis. PAHO's response to tuberculosis focuses on six key areas: providing regional leadership and fostering partnerships, advancing research and innovation, setting and promoting evidence-based norms and standards, developing ethical policy options, offering specialized technical support to countries, and monitoring and reporting (9).
In September 2023, global Heads of State reaffirmed their commitment at the second United Nations High-Level Meeting on Tuberculosis with a new political declaration that includes ambitious targets to be met by 2027 (10). They agreed that countries should accelerate implementation of evidence-based tools and innovations, including: more sensitive screening tools such as digital X ray with artificial intelligence to increase tuberculosis detection, rapid molecular tests for early diagnosis, shorter treatment regimens that can increase the treatment success rate, and tuberculosis preventive treatment to break the community transmission and prevent new infections. A multisectoral response is required, including the meaningful participation of members of parliaments, civil society, and affected communities.
Vector-borne diseases
The dynamics of yellow fever cases in the Americas has varied significantly over the years. Arboviral disease with a sylvatic reservoir is present in 13 countries of the inter-tropical area of the Region; while the complex nature of this disease makes accurate forecasting for the expected number of yellow fever cases difficult, planning concrete actions for prevention and control is nonetheless essential.
PAHO is implementing the Elimination of Yellow Fever Epidemics initiative: a focus on expanding yellow fever vaccination coverage, strengthening the laboratory networks, and expanding the surveillance and characterization of epizootics. This includes preparing guidelines for district, state, and national levels. PAHO has also developed a detailed map of yellow fever risk areas based on environmental and geographical conditions, which guide the establishment of vaccination policies (11). The number of malaria cases has also varied considerably over the years. The projection for 2030 is 487 698 cases. Changes in malaria incidence in recent years confirm the strong connection between malaria transmission and social and economic factors that generate population movement and changes in land use. From 2016 to 2019, the increase in gold mining in South America generated a significant increase in transmission. By 2023, mining areas and Indigenous communities became the areas with the highest transmission in the Region.
To combat malaria, PAHO developed the Plan of Action for Malaria Elimination 2021–2025 in consultation with countries and regional partners. This document guides national plans and promotes an inter-programmatic and intersectoral approach, along with joint efforts between countries and partners. The document emphasizes the need to address key malaria foci in each country with specific, information-based operational solutions. Continuation of these initiatives is crucial to control and eventually eliminate malaria in the Americas (12).
Figure 13. Projected malaria cases in the Region of the Americas
Source: World Health Organization Global Malaria Programme. World malaria report 2023. Geneva: WHO; 2023. Available from: https://www.who.int/publications/i/item/9789240086173.
Leaving no one behind: Measuring and addressing inequity
The Region faces deep-rooted structural inequalities that significantly impact health outcomes and opportunities (13). The more than 30 diseases and conditions in the Elimination Initiative disproportionately affect those living in situations of vulnerability, who face stigma, environmental challenges, and limited access to health care. For example, Indigenous communities in El Chaco (spanning several countries in South America) and La Mosquitia (in Honduras) still struggle with diseases eliminated elsewhere, highlighting the persistent impact of inequality on health.
For the Elimination Initiative to succeed, Member States must address underlying health inequities and recognize social and environmental determinants of health. The first step in this process is rigorous health inequality assessments, which help Member States address inequities while working toward elimination targets, ensuring no one is left behind. Such assessments typically involve examining how health outcomes are distributed across different social groups. For example, health programs might look at the incidence of a disease, comparing individuals based on their income levels, or how health outcomes vary across different geographical areas (like countries or districts) ranked by social factors. Sex, gender, ethnicity, disability, and age, for example, are important dimensions that can affect health outcomes.
Health programs can measure these health inequalities using summary statistics such as the slope index of inequality (SII) and the concentration index (CIx). The SII is used to quantify inequality in health outcomes, most often based on education or income. It represents the absolute difference in health outcomes between the hypothetical individuals at the bottom and top of the education or income distribution. The CIx measures relative health inequality by quantifying how a health variable is distributed across socioeconomic groups. It provides a summary statistic that indicates whether the health outcome is disproportionately distributed among the poor or the wealthy. For both of these values, a value of 0 indicates perfect equality, while negative values show concentration among the disadvantaged (poorest groups) and positive values among the advantaged (richest groups). Both measures are useful for comparing health inequalities across different populations or time periods and are widely used in health economics and epidemiology. SII measures absolute inequality (the actual difference in outcomes), while CIx measures relative inequality based on a concentration curve, indicating how health outcomes are distributed across socioeconomic groups (14, 15).
Tables 2 and 3 present SII and CIx measures, created using data from the Global Burden of Disease 2021 Study (16) and PAHO's sustainable development index. Table 2 shows the summary measures of inequality (SII and CIx) in the incidence of selected diseases over time, along with the corresponding regional incidence average rates. Table 3 shows those values in mortality for the same diseases. Results indicate high and persistent cross-country inequalities (note the mostly negative values in the SII and CIx columns). For some diseases, the excess incidence in the most affected countries was more than double the regional average in 2021. The mortality burden is also disproportionately concentrated in the most disadvantaged countries.
Table 1
Inequality in incidence of selected diseases in the Elimination Initiative
Region of the Americas: 2015, 2019, 2021 data.
| Disease | Year | Regional Average (x) | Absolute Inequality (SII) | Relative Inequality (CIx) |
|---|---|---|---|---|
| HIV/AIDS | 2015 | 18.9 | -4.8 | -5.1 |
| 2019 | 19.0 | -5.4 | -5.0 | |
| 2021 | 18.2 | -4.7 | -4.4 | |
| Cervical Cancer | 2015 | 10.9 | -7.7 | -13.0 |
| 2019 | 11.0 | -9.5 | -16.3 | |
| 2021 | 10.9 | -10.2 | -18.2 | |
| Tuberculosis | 2015 | 19.1 | -80.3 | -47.5 |
| 2019 | 18.6 | -72.4 | -45.6 | |
| 2021 | 18.2 | -70.1 | -45.1 | |
| Hepatitis B | 2015 | 218.8 | -333.6 | -25.6 |
| 2019 | 196.1 | -301.9 | -25.1 | |
| 2021 | 186.0 | -305.9 | -26.1 | |
| Hepatitis C | 2015 | 69.6 | -59.3 | -18.4 |
| 2019 | 67.4 | -54.1 | -16.4 | |
| 2021 | 67.6 | -52.6 | -16.2 |
age standardized rates per 100,000 population. Data for 36 countries of the Americas
Source: Institute for Health Metrics and Evaluation. Global Burden of Disease 2021: findings from the GBD 2021 study. Seattle: IHME; 2024. Available from: https://www.healthdata.org/researchanalysis/library/globalburden- disease-2021-findings-gbd-2021-study.
Table 2
Inequality in mortality of selected diseases in the Elimination Initiative
Region of the Americas: 2015, 2019, 2021 data.
| Disease | Year | Regional Average (x) | Absolute Inequality (SII) | Relative Inequality (CIx) |
|---|---|---|---|---|
| HIV/AIDS | 2015 | 5.2 | -8.6 | -34.7 |
| 2019 | 4.4 | -7.9 | -36.0 | |
| 2021 | 4.1 | -7.1 | -34.2 | |
| Cervical Cancer | 2015 | 4.1 | -7.0 | -27.0 |
| 2019 | 4.0 | -7.2 | -29.2 | |
| 2021 | 3.9 | -7.2 | -30.5 | |
| Tuberculosis | 2015 | 2.3 | -10.7 | -53.9 |
| 2019 | 2.1 | -8.7 | -51.2 | |
| 2021 | 2.0 | -8.1 | -52.2 | |
| Hepatitis B | 2015 | 2.8 | -0.06 | -34.5 |
| 2019 | 2.4 | -0.05 | -33.0 | |
| 2021 | 2.3 | -0.04 | -31.8 | |
| Hepatitis C | 2015 | 0.63 | -0.01 | -33.4 |
| 2019 | 0.59 | -0.01 | -29.2 | |
| 2021 | 0.55 | -0.01 | -28.5 |
age standardized rates per 100,000 population. Data for 36 countries of the Americas
*age standardized rates from 10,000 population
Source: Institute for Health Metrics and Evaluation. Global Burden of Disease 2021: findings from the GBD 2021 study. Seattle: IHME; 2024. Available from: https://www.healthdata.org/researchanalysis/library/globalburden- disease-2021-findings-gbd-2021-study.
Case study: patterns of inequality in four countries
Health disparities observed among countries for these diseases (in Tables 2 and 3) also exist within countries. The uneven distribution of risk for incidence and mortality from these diseases is replicated at smaller geographic levels within nations. This pattern, influenced by social and environmental factors, is demonstrated in Figure 14. Each panel in Figure 14 demonstrates how health outcomes for selected diseases vary within a selected country, based on socioeconomic factors.
Panel A presents cervical cancer incidence across 33 departments in Colombia, grouped by poverty levels. The poorest areas have 8 more cases per 100 000 women (a 64% higher incidence) than the richest areas (17).
Panel B presents HIV incidence in the United States across 51 states and territories, ranked by the sociodemographic index (SDIx), a composite indicator that measures sustainable development across three key dimensions: economic, social, and environmental. The figure shows a difference of 7 cases per 100 000 people between the highest and lowest groups (16).
Panel C presents tuberculosis mortality data from Mexico across 32 federal entities ranked by SDIx. The SII is -0.90, meaning there is 1 additional death per 100 000 people across the social gradient. While this seems small, it represents about 50% of the national tuberculosis mortality rate.
Panel D shows how new cases of hepatitis B are distributed across Brazil's 27 federative units, which are ranked according to SDIx. The graph suggests a moderate level of inequality: 60% of Brazil's new hepatitis B cases were found in the half of federative units that are most socially disadvantaged (16).
Figure 14. Inequalities within countries for selected diseases in the Elimination Initiative
As the above data illustrate, health inequalities deeply rooted in social factors are widespread across the Americas. As the Region works toward eliminating communicable diseases, it is crucial to understand the mechanisms behind inequalities and to closely monitor changes over time. In other words, PAHO and Member States should not just focus on reaching difficult-to-access groups but also on addressing the underlying social factors that make these groups more susceptible to inequality. This means developing strategies and implementing effective, culturally appropriate interventions that can create lasting positive changes in the social conditions affecting these groups. By doing this, prioritizing the most marginalized and socially excluded groups will be possible.
References
- Bray F, Laversanne M, Sung H, Ferlay J, Siegel RL, Soerjomataram I, et al. Global cancer statistics 2022: GLOBOCAN estimates of incidence and mortality worldwide for 36 cancers in 185 countries. CA Cancer J Clin. 2024;74(3):229–263. Available from: https://doi.org/10.3322/caac.21834.
- Pan American Health Organization. Plan of action for cervical cancer prevention and control 2018–2030. Washington, D.C.: PAHO; 2019. Available from: https://iris.paho.org/ handle/10665.2/38574.
- Pan American Health Organization. Cholera resurgence in Hispaniola. Washington, D.C.: PAHO; 2024 [cited 13 September 2024]. Available from: https://shiny.paho-phe.org/cholera.
- Pan American Health Organization. Cholera: technical guidelines and resources. Washington, D.C.: PAHO; [date unknown] [cited 13 September 2024]. Available from: https://www.paho.org/ en/resurgence-cholera-hispaniola/cholera-technical-guidelines-and-resources.
- Pan American Health Organization. Water and sanitation. Washington, D.C.: PAHO; [dateunknown] [cited 13 September 2024]. Available from: https://www.paho.org/en/topics/water-and-sanitation.
- Pan American Health Organization. Air quality. Washington, D.C.: PAHO; [date unknown] [cited 13 September 2024]. Available from: https://www.paho.org/en/topics/air-quality.
- Pan American Health Organization. Combination HIV prevention. Washington, D.C.: PAHO; [date unknown] [cited 11 September 2024]. Available from: https://www.paho.org/en/topics/combination-hiv-prevention.
- Pan American Health Organization. HIV/AIDS. Washington, D.C.: PAHO; [date unknown] [cited 11 September 2024]. Available from: https://www.paho.org/en/topics/hivaids.
- World Health Organization. Tuberculosis. Geneva: WHO; 2023 [cited 11 September 2024]. Available from: https://www.who.int/news-room/fact-sheets/detail/tuberculosis.
- World Health Organization. UN General Assembly high-level meeting on the fight against tuberculosis, 2023. Geneva: WHO; 2023. Available from: https://www.who.int/activities/ preparing-for-the-un-high-level-meeting-on-the-fight-against-tuberculosis--2023.
- Pan American Health Organization. Yellow fever. Washington, D.C.: PAHO; [date unknown] [cited 13 September 2024]. Available from: https://www.paho.org/en/topics/yellow-fever.
- Pan American Health Organization. Malaria. Washington, D.C.: PAHO; [date unknown] [cited 13 September 2024]. Available from: https://www.paho.org/en/topics/malaria.
- Commission of the Pan American Health Organization on Equity and Health Inequalities in the Americas. Just societies: health equity and dignified lives. Report of the Commission of the Pan American Health Organization on Equity and Health Inequalities in the Americas. Washington, D.C.: PAHO; 2019. Available from: https://iris.paho.org/handle/10665.2/51571.
- World Health Organization. Handbook on health inequality monitoring with a special focus on low- and middle-income countries. Geneva: WHO; 2013. Available from: https://iris.who.int/ handle/10665/85345.
- Mújica OJ, Moreno CM. From words to action: measuring health inequalities to "leave no one behind." Rev Panam Salud Publica. 2019;43:e12. Available from: https://doi.org/10.26633/RPSP.2019.12.
- Institute for Health Metrics and Evaluation. Global Burden of Disease 2021: findings from the GBD 2021 study. Seattle: IHME; 2024. Available from: https://www.healthdata.org/researchanalysis/ library/global-burden-disease-2021-findings-gbd-2021-study.
- Pardo C, Cendales R. Incidencia, mortalidad y prevalencia de cáncer en Colombia, 2017–2021. Bogota: Instituto Nacional de Cancerología; [forthcoming 2024].